Work in progress on natural selection in the US
The data isn't doing what the theory tells it to
Here’s a quick note on natural selection in the United States. This is very early stage, so don’t take it as gospel yet!
My paper with Abdel Abdellaoui (ungated version) found two patterns in the UK:
Polygenic scores that predicted higher education also predicted lower fertility (number of children born), and vice versa, scores that predicted lower education predicted higher fertility.
Correlations with fertility were higher among people with lower incomes or less education, single parents, and women who had their first child younger.
We explained both of these with the economic theory of fertility. People trade off time spent raising children and time spent earning money. Those who expect higher wages have fewer children (point 1). And this trade-off is sharper if you are poorer or a single parent (point 2).
Our theory partly came from noticing patterns in the data, so we’d like to test it independently. We can do this in the US population. I’m using the Health and Retirement Survey, which goes back to people born in 1920. It’s smaller than UK Biobank, but more representative:
I’ll also use the polygenic scores provided by the Polygenic Index Repository (yay!) These are provided for both black and white survey respondents. As regular readers will know, most polygenic scores were estimated using European-ancestry subjects and are less accurate for others. Also, the scores are normalized to have mean 0 and variance 1 in each ethnic group. So I won’t do much comparing of the two groups, I’ll just treat them as samples from two different populations.
Point 1 checks out. In the figures below, each dot is a polygenic score. The x axis is the score’s correlation with years of education. The y axis is the score’s correlation with fertility. (Strictly speaking, they are the coefficients from a linear regression, where the independent variable is a change of one within-ethnicity standard-deviation in the score. We need a word for something that’s an “effect” in a regression, but shouldn’t be interpreted causally….)
The lines are downward sloping: scores which are associated with more education are associated with fewer kids. They’re significant at 5% for whites but just miss it for blacks.1 In general, the smaller sample size of black people makes it hard to say anything with certainty. Still, overall, this fits our theory.
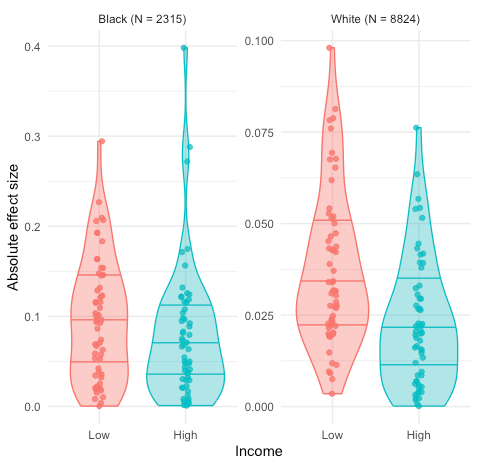
Point 2 does not look so good. Below are violin plots of the absolute size of effects on fertility, among people with up to 12 years education, or 13 or more years. The “violins” summarize the distribution… really all that matters is the dots, which show the raw data… but violin plots look cute. The horizontal lines show quartiles. Notice, that the scales are different for blacks and whites, and anyway, as I said, the raw scores are scaled differently. So look at each group separately.
According to our theory, you’d expect effect sizes to be bigger among the less educated. Well, maybe, but the difference doesn’t stand out, and it certainly isn’t significant.
What about income?
That’s a bit more promising — the median score is certainly larger for whites — but again, it’s not significant.
Next, marital status:
Here at last we have a clear result. Correlations with fertility are much lower for married than unmarried whites, and this is significant. (I lumped divorced, never-married and others together to keep things simple.) For blacks there is no difference, which I think is surprising.
Lastly, here’s age at first birth, split within each ethnic group at the median:
I should probably split this by gender (except then the sample size would get even smaller, argh). Anyway, for now, there’s no big difference.
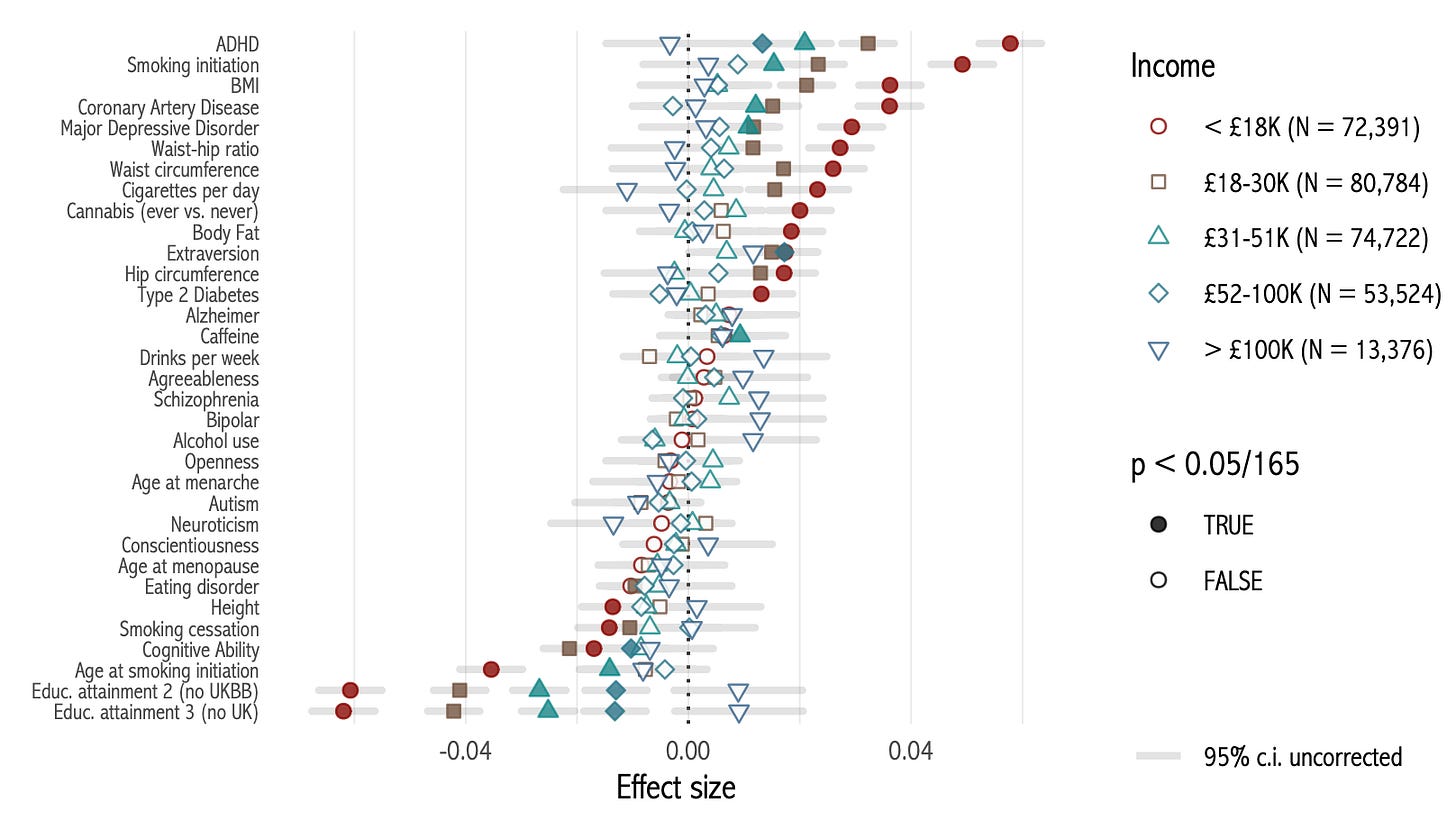
Overall, the US does not look like the UK. The UK had really big differences in effect sizes. For example, look at effects on fertility by income:
Most effects were much smaller and insignificant among richer groups. The same was true for education. And for age at first birth, effects actually went in opposite directions among older and younger mothers.2
For whatever reason, these patterns are far less strong in the US data. That could be partly down to smaller sample size; some effects, like income, weren’t significant even though they looked right. But if differences between categories were as big as in the UK, I think they would be visible here.
Why is that? I don’t know! One answer could be the welfare state; the UK had some welfare support for mothers even before 1945, whereas many of the US sample would have had children before the Great Society programs of the 1960s. Or maybe class differences just are/were stronger in Britain? Or it could easily be something more mundane —the set of polygenic scores is different, I’ve made a coding error somewhere…. Anyway, as usual, the data haven’t done exactly what I expected.
Code is here, and is likely to change. Data is available from the HRS. (I mostly used the Rand files, which are much easier to work with.)
Update, 19/9/2023: the latest PDF on github is now just about a first draft. I removed almost all the analysis of the black sample, because there just aren’t enough respondents to be informative. And I got rid of the violin plots 😢.
If you enjoyed this, you might like my book Wyclif’s Dust: Western Cultures from the Printing Press to the Present. It’s available from Amazon, and you can read more about it here.
You can also subscribe to this newsletter (it’s free):
I bootstrap the sample to calculate significance; obviously the polygenic scores are not a “sample” of anything, the sample here is the respondents.
This factoid goes around Twitter a lot. I worry that it is slightly misleading. It gives the impression that “selection is in the opposite direction for older parents”. But this ignores that a huge part of scores’ overall “effect” on fertility is their effect on age at first birth! Older parents have fewer kids. So overall, it’s not that older parents are being selected for higher educational attainment etc.


“We need a word for something that’s an “effect” in a regression, but shouldn’t be interpreted causally…” — regression coefficients are transformed partial correlations (or actual partial correlation if you standardize all your variables). So partial correlation could work.