Natural selection: what's the effect size?
A work in progress, a.k.a. a cry for help
Warning: nerdery ahead.
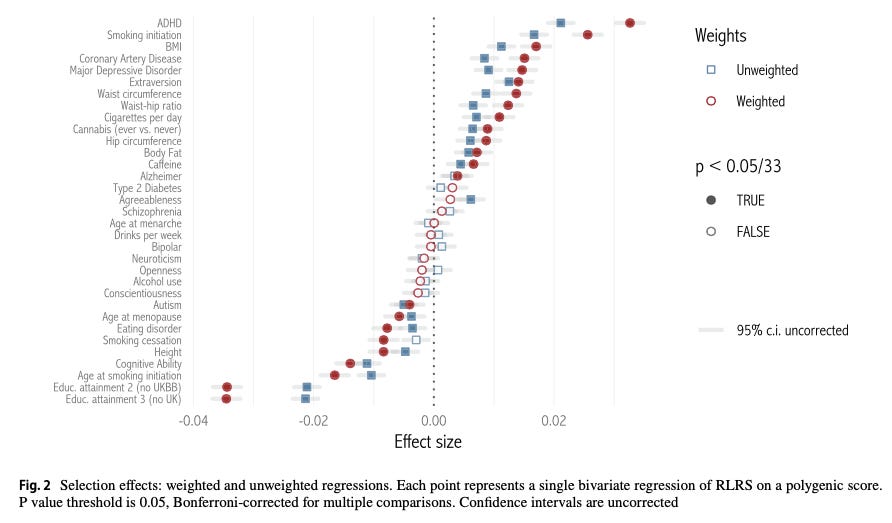
Our paper on natural selection (previously discussed here, here and here) found that many polygenic scores are significantly correlated with the number of children a person has, i.e. their realized fertility.1

One thing the paper doesn’t discuss in depth is how important these effects are. In particular, as I wrote in my earlier discussion:
… the effect sizes we describe are small. For example, our correlations between the “EA3” polygenic score for educational attainment, and realized fertility, predict that the next generation will have an average EA3 score of –0.04 to –0.08, compared to this generation’s average of 0.
Actually, the published paper had smaller estimates still, after we corrected an error: the effect size was -0.03 standard deviations. To get a sense of this, here are two normal distributions, one with a mean of 0, one with a mean of -0.03:
These don’t look very different. If the mean of a polygenic score went down from 0 to -0.06 over a generation, then 51.2% of the new generation would be below the average of the old generation. Hardly a big deal. If this is the true change, then contemporary natural selection is just an interesting theoretical curiosity.
But that is not the whole story. As I also said:
Our effect sizes are small, but our measures are noisy… polygenic scores are still very inaccurate…. If we had more accurate polygenic scores… our effect sizes — correlations with fertility — might get larger. That is, since we are using an inaccurate score, we may underestimate the true effect of the “real” score.
To be more precise, if you regress a dependent variable on an independent variable which is measured with random “noise”, then the estimated effect of your independent variable will shrink towards zero, compared to the effect of the true, noise-free independent variable. The amount of shrinkage will be proportional to the amount of noise.
We can estimate how much noise our polygenic scores have. For example, the true heritability of educational attainment is about 40%. That means that if we had the “true polygenic score” for educational attainment, it would explain about 40% of variation in actual education. But our existing, noisy polygenic score only explained about 4.5% of the variation in education among our sample. The ratio between these two is 40/4.5 = 8.9. That number gives how much the estimated effect on fertility will shrink because of the noise. To reverse this and back out the effect of the true polygenic score, we can multiply our estimated effect sizes. That gives an estimate of about -0.03 × 8.9 = -0.26.
UPDATE: hey no, this is not correct. See the discussions below. The correct correction is to take the square root of the ratio of correlations, i.e. sqrt(8.9) = 2.98! That gives an estimated change in the effect size of -0.03 × 2.98 or roughly -0.09.
So, if you were worried by this post about the total effect of natural selection, you should be about, uh, three times less worried now? A change in one generation of 0.1 standard deviations is not trivial, but it’s less serious than 0.25 standard deviations.
Here are two normal distributions, one with a mean of 0 and one with a mean of -0.26:
That is quite a big difference. If the mean “true” polygenic score goes down from 0 to -0.26 in a generation, about 60% of people in the new generation will be below the average of the old generation. And don’t forget that we found natural selection persisting over at least two generations. If so, 70% of people today might have a lower “true” polygenic score for educational attainment than the average of two generations ago.
If this were true, natural selection would almost inevitably be having large effects on our economy, society and labour markets. Even if you think that improvements in schooling have compensated for this change in genetics, our society would still be worse off than if it had the better schooling with no change in genetics!
Effects of this size would also matter for equality. Remember that we found large effects of natural selection among poorer people and small or no effects among richer people. Our effect size for PSEA among the poorest 20% of the sample was about -0.06. Correcting that for noise, the true effect size might be -0.06 × 8.9 = -0.53. The correct correction would be -0.06× 2.8, or about -0.18. Natural selection would mean that the children of the richest and poorest 20% had drifted apart by more than half a standard deviation in true polygenic score — again, in just one generation. A change of that size might have contributed to the increase in inequality in the US and the UK over the past fifty years.
Lastly, changes like this would have big effects at the top and bottom. Polygenic scores are normally distributed, which means that changes in the average have disproportionately large effects on the tails. For a normal variable with mean 0, about 2.2% of people are 2 standard deviations or more below the mean. If we shift the mean down to -0.26, then the percentage below this point almost doubles, to 4.1%. Again, not so much as that. And the actual change would be bigger, because for educational attainment, natural selection is isn’t just shifting the mean, it’s also increasing the variance, i.e. spreading the distribution out. In short, natural selection might be dramatically increasing the numbers of people with a genetic endowment that could make life quite hard for them.
This is the end of the wrong bit. The rest of the post, which is about looking at rare variants is fine. (I think!)
But is it true?
Unfortunately, or perhaps fortunately, the calculations above are not guaranteed to be right. They make some assumptions. In particular, they assume that the unmeasured part of the “true polygenic score” has proportionally the same effect on fertility as the measured part.
Here’s one way that could be wrong: suppose that the unmeasured genetic variation that contributes to educational attainment mostly comes from very rare variants, which aren’t captured in UK Biobank’s DNA records. And suppose these variants are more likely to have serious effects, that don’t just lower your years of education, but make it harder to become a parent. There’s a reason that might be true: common variants must have already spread through the population to some degree, so they can’t be too bad for people’s fitness. Rare variants and new mutations have not passed this filter.
If so, then these rare variants which reduce your educational attainment would also lower your fertility, rather than increase it like the common variants whose effects we have measured. So then, including these rare variants would dampen the effect of natural selection on polygenic scores, rather than magnify it. That is an extreme scenario; more generally, it is possible that rare variants which affect education just have a relatively weaker effect on fertility than common variants which affect education.
So, how can we find out what is really going on?
The simplest way would be “make better polygenic scores, then correlate them with fertility”. In other words, we just wait for our polygenic scores to capture more of that 40% heritability, and see if our effect sizes on fertility increase. Progress so far has been steady, so this will work sooner or later. If you are e.g. planning to do some whole genome sequencing to predict education, I encourage you to look at the correlations with fertility.
A possible alternative approach is to look at the different genetic variants we already know about, and try to work out if common and rare variants have the same relationship between a variant’s effects on fertility and (e.g.) education. If they do, then we’ll be more confident that will continue to hold in the rare variants we don’t know about.
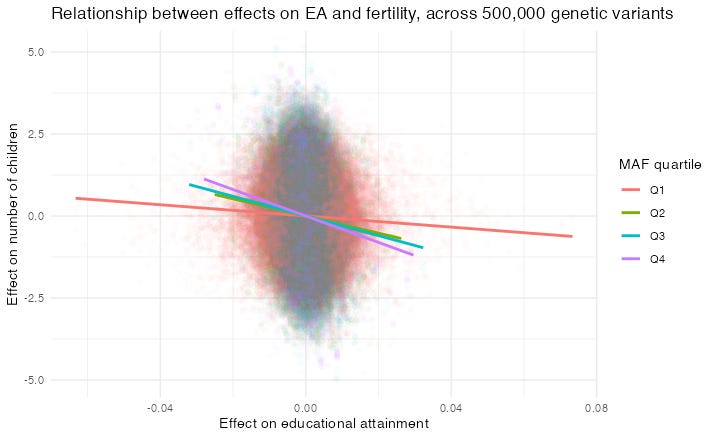
The picture below shows the relationship between a variant’s estimated effect on educational attainment, and its estimated effect on number of children born, for 500,000 variants. I’ve drawn four regression lines, one for each of four quartiles of Minimum Allele Frequency, from the rarest 25% of variants, to the most common 25%. As you can see, the regression lines are flatter for rare variants, especially those in quartile 1 (the rarest 25%).

So at first glance it seems that indeed, the fertility/education relationship will get weaker when we include the rarer variants that we haven’t yet measured.
But there’s a catch. Each dot in the graph shows one variant’s estimated effect on fertility and estimated effect on education. Now, for rarer variants, these estimated effects are noisier. That’s because with rare variants, we have fewer people to estimate their effect from.
So now we have the same problem as before: the relationship between these estimated effects will be weaker for rarer variants, because they contain more noise! Even if variants’ true effects on fertility and true effects on education always are in the same proportion, the measured effects of rare variants on fertility and education will be less correlated.
As a result, I still don’t know whether the flatter relationship reflects reality, or is just a statistical artefact.
I think there is probably some clever maths to work out what the relationship between estimated effects should be across rare and common variants, assuming that the true relationship stays constant. But so far, I am too bad at statistics to work it out. If you think you can help, get in touch!
If you enjoyed this, you might like my book Wyclif’s Dust: Western Cultures from the Printing Press to the Present. It’s available from Amazon, and you can read more about it here.
You can also subscribe to this newsletter (it’s free):
Here and below, I use fertility to mean the number of children a person actually has, not whether they’re capable of having children.


"...it would explain about 40% of variation in actual education. But our existing, noisy polygenic score only explained about 4.5% of the variation in education among our sample. The ratio between these two is 40/4.5 = 8.9."
Don't you need to square root those numbers to get the effect size ratio?