


Natural selection: I still have no clue about the effect size
A scientific report of "meh"
Recap: I’m trying to find out how much natural selection there is against the genetics of educational attainment (EA). In particular I’m comparing rare alleles (genetic variants) to common alleles, to see if the EA/fertility relationship is the same in the two groups.

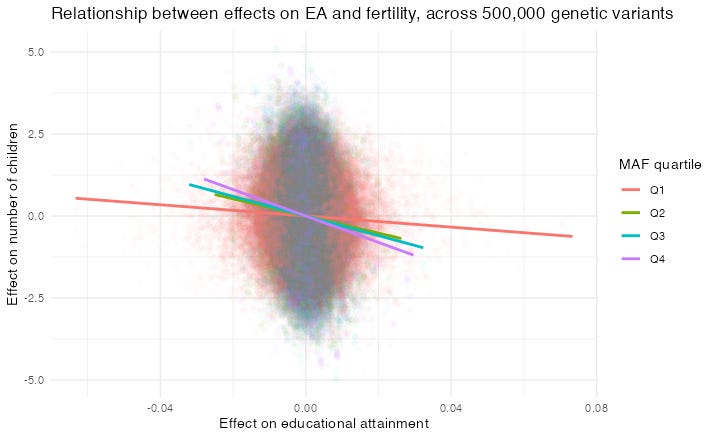
I drew this graph showing the EA/fertility slope for four quartiles of Minimum Allele Frequency (MAF), i.e. the allele’s rarity. Each dot represents the effect of an allele at a given Single Nucleotide Polymorphism (SNP; sorry about all the acronyms). Indeed the slope is flatter for rarer alleles. But that might be because it is underestimated, due to errors in the independent variable — the effect of each allele on EA.
As often happens, talking about this made me think more. So, now I divided my 2 million SNPs up, not into four quartiles, but into about 250 groups. I grouped them not by the MAF, but by the amount of noise in the allele’s estimated effect on EA. (I’ll say why in a moment.)
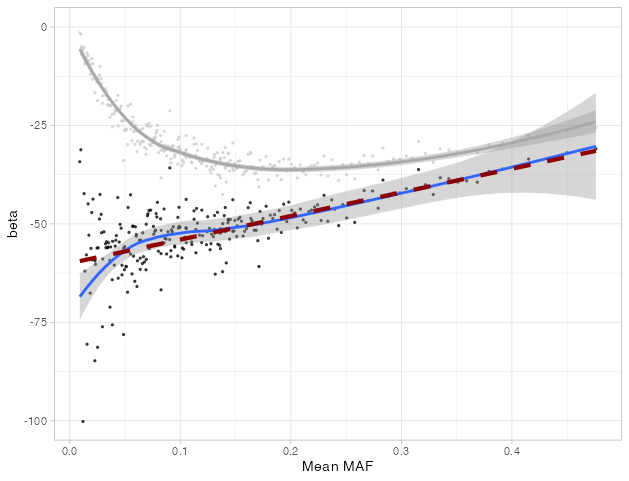
Rather than draw 250 sloped lines, below I have plotted one dot for each group, with its average MAF on the x axis, and its EA/fertility relationship on the y axis. The blue line plots the smoothed average value at each MAF.1

Just as before, the EA/fertility relationship gets much smaller for rare alleles, and just as before, this is partly due to errors in variables, because rare alleles’ effects are measured with more noise.
But now I worked out a way to correct for this, using the noise in the estimate of the EA effect. (That’s why I grouped the SNPs by this, and not by MAF directly.) Technical details are below for the nerds.
I wasn’t sure that my method would work, because (a) it was using an approximation that might not be perfect and (b) maybe I’m an idiot and my statistics are wrong. To test it out, I used simulations.
Sim city
Computer simulations are like a Swiss Army Knife for me. I use them to check that my maths is right when I do theory. To test power in an experiment, I simulate data and run the statistics I plan to use. Here, I created some imaginary data with a “ground truth” EA/fertility relationship, created some noisy “observations” of EA effects and fertility effects, and checked that my method recovers the ground truth. I kept as close as possible to the real data, to make the simulation more realistic.

In the graph above, the red dashes shows my simulated ground truth relationship between EA and fertility: it’s the same at all values of MAF. The grey dots are simulated EA/fertility effects within each group, from my simulated noisy observations. The grey line is a smoothed average through those dots. You can see it is far from the ground truth, and gets farther for rare alleles. The black dots show my corrected estimates, the blue line is a smoothed average, and it gets pretty close to the ground truth!
… Except when it doesn’t. At low values of MAF it veers off a bit. That’s a bummer because low values of MAF are exactly what we care about. Unfortunately, this was not a one-off. In all my simulations, my correction was less accurate below a MAF of about 0.05:
Anyway, armed with this method, I went back to the real data and plotted the corrected estimates. Below, the dots are the corrected estimates and the blue line is a smoothed average. The grey line is the old uncorrected smoother, for comparison.

As you can see, the corrected estimates still show that the EA/fertility relationship is smaller for rare alleles, although it no longer gets close to 0.
What have we learned?
Um. In my view, not much.
The MAF/effect size slope gets steeper below MAF of 0.1, but unfortunately this is where my correction starts to become less trustworthy.
There is a slope even above MAF of 0.1. So we can probably reject that the EA/fertility relationship is constant everywhere.
If you took that smoothing line seriously, you might expect the fertility/EA relationship to be about half the size for rare alleles (MAF of almost 0) as for common alleles with MAF of 0.5.
But more fundamentally, the rarest allele in the whole dataset has a MAF of about 0.001. So, about one in a thousand people has this allele, i.e. millions of people worldwide! I think it is very hard to extrapolate from that to very rare mutations which perhaps only one person in a million or a billion have. And the data show no simple linear relationship with MAF that you might feel confident in extending.
Yet in the aggregate, rare mutations might have a big impact on EA, fertility and the relationship betweeen them.
I think this is a fundamental limitation on the whole approach. The results we have are compatible with either no EA/fertility relationship for very rare alleles, or a substantive EA/fertility relationship for very rare alleles (about half the size as for common alleles, but that’s still substantive).
In the end, this was always a kludgy workaround, and it’s probably reached its limits. It seems as if to find out the effect of natural selection on EA, we are just going to need more accurate polygenic scores.2
Meh. Science is hard, let’s go shopping.3
How I corrected the estimates: technical details
When you have noise in your independent variable X, the estimated relationship from linear regression is biased towards zero by a factor of
Within each group, I estimated the variance of the noise by taking the square of the average standard error of the estimates of EA, as reported in the original summary statistics from SSGAC. I estimated “variance of noise + variance of true X” by taking the variance of the estimates themselves. Then I divided my estimated coefficient of EA on fertility by the bias factor.
There are lots of questions here:
How to group the data? Bigger groups make the EA/fertility relationship more accurate, but if you lump together SNPs with different standard errors, then the approximation of taking the average error gets less accurate. I used trial and error with the simulations to decide this. In the end I tried to use bigger groups where the standard errors were larger. Many observations have exactly the same standard error, so I ended up with 256 groups.
Weighting. Probably I should weight the EA/fertility relationship estimation within each group by the inverse of the error of the SNP EA effect. Probably I should also weight the result of each group by the inverse of its error. But then I’d have to correct not just the estimate, but the error bands, and that’s a hard problem.
Correcting for correlation among the SNPs (“linkage disequilibrium”). I have no idea what to do about this, or if it matters. I’m using corrected standard errors from the summary statistics, blindly hoping this helps.
Here is a very rough working paper, if you want more details.
If you enjoyed this, you might like my book Wyclif’s Dust: Western Cultures from the Printing Press to the Present. It contains absolutely no regressions or simulations, but lots about Egyptian religion, Puritan butter measurement, and the fate of the glass ceiling from Hilary Clinton’s victory celebration. It’s available from Amazon, and you can read more about it here.
You can also subscribe to this newsletter (it’s free):
Aficionados will have spotted that I am running a regression on regressions on regressions here 🧐.
I should also probably learn more, using GCTA or such, about how much of the variance is explained by the common SNPs in the existing data; and directly measure the effects of the EA1, EA2, EA3 and EA4 scores on fertility, in a single sample.
Although! It’s much more fun writing a blog post than writing a dull paper for a journal.
Ok. So you mean: measured snp X1 correlates with unmeasured causal snp X2. But not perfectly. So there is some estimated error from the people who do or don’t have X1. But there is also some error from people who do/don’t have X2, and this won’t be picked up by the reported SEs? Or will it? Thinking about it, I don’t see why it wouldn’t be. But need to think more.
> Correcting for correlation among the SNPs (“linkage disequilibrium”). I have no idea what to do about this, or if it matters. I’m using corrected standard errors from the summary statistics, blindly hoping this helps.
This is my first thought. The summary statistics wouldn't tell you the standard error from measurement error in the causal variant. So there's hidden inflation of error: you have simple sampling error from the rare variant being rare, yes, but you also have sampling error from all of the people who do/do not have the rare variant which is driving the signal. This would create a steadily increasing bias the rarer the variant is, I'd think?