Why I am not a polygenic score nihilist
Here is a good, very comprehensive introduction by Scott Alexander to the debate about missing heritability. This post is much shorter and is going to just focus on one aspect — the value of polygenic scores.
The fundamental issue that sceptics point out is that the R-squared of many polygenic scores on the outcome they are meant to explain is low, especially after you clean up the polygenic scores to stop them accidentally capturing environmental differences. (Here is an example from Eric Turkheimer.) I think this is true, but I question its relevance. Here’s why.
The R-squared is the proportion of variation in one thing explained by another. Here’s two examples using data I made up on my computer.
The first shows a highly unrealistic polygenic score (PGS), which perfectly explains educational attainment, measured as the age of leaving education. If you have a PGS of -2, you leave school at 16. If you have a PGS of 2 you leave school at 20. A person’s educational attainment is always exactly his polygenic score plus 18, with no environmental variation at all. The R-squared of the PGS is 100 per cent: it explains all the variation in educational attainment. The black dots show fifty people’s PGS and educational attainment; every single dot fits exactly on the red regression line, which shows the relationship between the PGS and education.
Now here’s a slightly less unrealistic polygenic score. This PGS is not so good at explaining people’s educational attainment: some of the people are above or below the red line. The R-squared is only 25%; three quarters of the variation in educational attainment is down to “the environment” (whatever that means — more on this later).
So, this polygenic score is a lot worse than the other one in terms of predicting education.
But if you look at the slope of the red line, there’s a surprise: it is exactly the same in both pictures. For both of these polygenic scores, if you score -2 you leave education at 16 on average, and if you score 2 you leave at 20 on average. There is a lot more random variation in the second picture, but the average effect of the polygenic score is the same.
In other words, the size of a variable’s effect is unrelated to the amount of variation it explains. This is not news to statisticians.
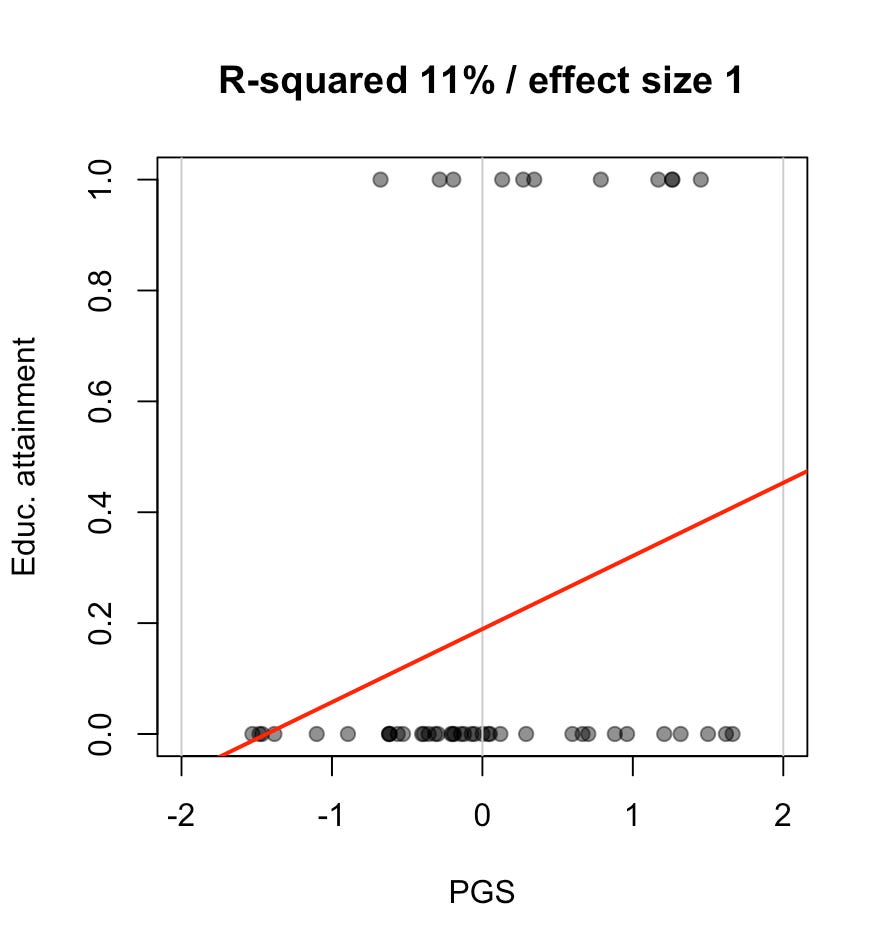
Let’s add one more tweak. We’ll measure educational attainment in terms of going to university. This is a zero-one variable: either you finish university or you don’t.
The R-squared is now even lower, a miserable 11%. But that is purely because we dichotomized the variable. I counted anyone that left education at 20 or more as going to university: this is a deterministic function of educational attainment in the last plot. The effect size on the underlying variable (years of education) is still the same — one extra point of PGS equals one extra year of education. The R-squared gets lower simply because it’s harder to fit a slope to points that are always zero or one. Again, none of this is news to statisticians.
Now let’s see some real data, from our trading genetics paper (simply because I have it to hand).
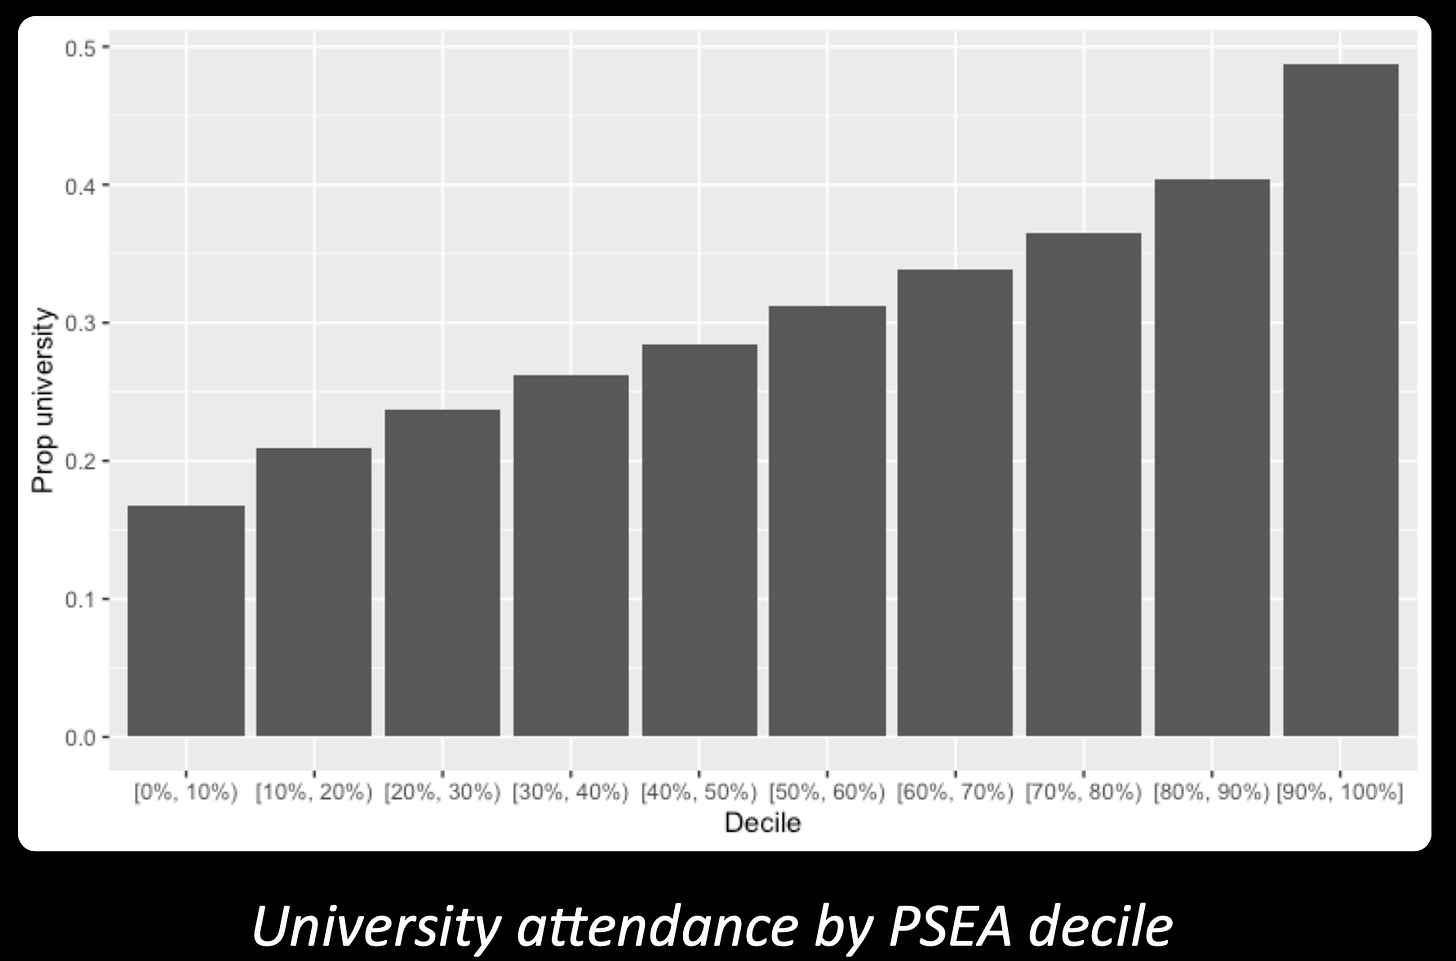
Here we’ve divided the sample up by deciles of the polygenic score for educational attainment, and simply plotted the proportion of each decile that went to university.
Less than 20% of the bottom decile went to university. Almost 50% of the top decile did. These differences are huge.
Polygenic score skeptics will correctly point out that not all of the difference is caused by the polygenic score! People with different PGS have parents with different PGS, live in different neighbourhoods, and have many other aspects of their environment that correlate with their PGS. This is true and very important to understand, and the work done recently to separate out causal effects from correlated noise is also very important.
We can measure the true effect of this PGS by looking at pairs of siblings. Because people’s genes are randomly allocated from their parents’ genes, differences between siblings are a true natural experiment. That doesn’t mean that siblings with different PGS won’t have different environments. They will! But any systematic differences in their environments will be — must be — caused by their genetics, interacting with their parents, their school environment, et cetera. Between siblings, the genetic differences come first in the causal chain.
When we do this in our sample, about half the effect of the PGS goes away. That’s pretty typical, and roughly fits the discovery that half of the differences in individual PGS’s are themselves capturing things about the shared environment.
The remaining effect is the true causal effect of the PGS. It’s now smaller, but is it small?
In the whole sample, a one standard deviation increase in someone’s PGS was associated with a 9.2 percentage point increase in the chance of going to university. That’s the huge effect you see in the graph. Among siblings, a one standard deviation increased your chance by 4.5 percentage points. That’s the true causal effect of the genetic differences captured by the PGS.
This is still, frankly, a very big effect. As we say in the paper “for a rough comparison, the effect on college attendance of the Moving To Opportunity experiment in the US was 2.5 percentage points”. Moving To Opportunity was an experiment where poor families were given the ability to move house to a much richer area — a huge, life-changing intervention by any standard. Yet it changes outcomes less than a one standard deviation shift in this polygenic score.
Put another way: moving from the 5th percentile to the 95th percentile of the PGS would increase your chances of going to university by about 15 percentage points. This is the kind of intervention that parents dream of! If you can find an environmental way of achieving the same thing, you will become rich and famous.
Note that this is still a “dirty” polygenic score which was estimated in a way that is likely to capture environmental effects (for the technical background on this see here). But the effect of the (genetics captured by the) polygenic score, when estimated by within-siblings regression, is still truly causal!
What’s the R-squared of the PGS in this case? Why should we care? I think that is not the relevant question. (Update: I checked a footnote in the main paper. The R-squared of EA on own university attendance is 0.04. I think this exactly proves my point: a low R-squared plus a very substantive effect.) The effect size, measured on real world outcomes, is very big. Low R-squared numbers reflect that there is a lot of environmental variation in educational attainment. Sure, but how much of this environmental variation is systematic in a way we can capture and make use of? Plausibly, a lot of it is just pure randomness. Adolescents make life-changing decisions, their life goes down different tracks at critical turning points: this is the stuff of novels, but it is not something that social scientists can either predict or use. A lot of what geneticists call “the environment” may simply be what scientists in general call “noise”. There’s nothing surprising about failing to explain noise, and the fact that some variable has a lot of noise is not intrinsically interesting.
So, genetics has big effects on outcomes we care about. Maybe it’s true that polygenic scores will never achieve the R-squared on outcomes that we’d expect from twin studies — the heritability that is still missing. Fine! I’m not here to defend twin studies. But the step from “R-squared is low” to “polygenic scores are unimportant” is a non sequitur. It is focusing on the wrong number.
I am not the first person to be sceptical of R-squared as a measure. It’s a very common attitude in statistics. Here is Andrew Gelman on R-squared for binary outcomes being weirdly low. Here is Cosma Shalizi on R-squared being not very useful and in particular not a measure of goodness of fit. In genetics, plenty of people have also been sceptical specifically of heritability (“h-squared”) as a statistic, where heritability is just the total R-squared of genetic variation on the outcome of interest. I don’t know why the debate continues to be couched in terms of R-squared and h-squared. Maybe it should stop.
So, I am not bothered by polygenic scores with low R-squared values, because I think that they can nevertheless have big substantive effects. Until I see evidence that those substantive effects are a mirage, I’ll continue to think polygenic scores are an important and valuable tool for social scientists, behaviour geneticists and others.
To repeat, none of this is to deny the importance of understanding the non-causal parts of the correlation between genes and outcomes. That’s independently important and interesting, and a key part of social genetics, and my co-authors in particular Abdel have done important research on the topic. We can do both.


https://open.substack.com/pub/ericturkheimer/p/news-flash-effect-size-doesnt-matter?r=a61h9&utm_medium=ios
I think you cannot really talk about the magnitude/value of an effect size without first explaining what you intend to use it for. There are rare variants explaining a tiny amount of population variance but providing very important information for drug targets (which can then explain a large amount of population variance when intervened on). On the other hand, a smoking polygenic score might explain a decent amount of variance in lung cancer risk but will be useless in a model that already includes smoking itself. What is the intended use of the PGS? A lot of the existing applications in behavior genetics want to have a "clean" causal instrument, and the population PGS is clearly not that (and, I would argue, confounded in ways can be extremely misleading).
The more general point I'd make is that if a field describes a trait with 80% heritability (like height) as "largely genetic" then it should describe a trait with 10-20% heritability (like IQ is shaping up to be and Edu already is) as "largely non-genetic". That's just being consistent.